Finding Osprey Server Logs
How new developers should use Grafana first, then kubectl through the EKS tunnel when they need live cluster evidence · ~10 min read ~– min read · Suggested by Laura engineeringoperations
Osprey's server logs are reachable two ways: Grafana for time-windowed search and correlation, and kubectl for live pod/deployment logs through the AWS EKS tunnel. A new developer should know both paths, because they answer different questions and fail in different ways.
Start With the Question
Use Grafana when you need to search. Use kubectl when you need a live tail, a quick deployment check, or the previous logs from a restarted container. Both paths read the same Kubernetes workload family, but Grafana is better for investigation and kubectl is better for immediate terminal evidence.
The Map
The main namespace is osprey-main. The four common deployments are osprey-api, osprey-web, osprey-mcp, and osprey-mock. Target deployments instead of individual pod names because pod suffixes change on every rollout.
Grafana Path
In Grafana, narrow before searching. Open Explore or the logs view, choose the logs data source, set the time range, filter to osprey-main, then narrow to the deployment or app label. Search for request IDs, job IDs, tenant clues, phone numbers only when policy allows, or the exact error text from the user report.
Kubectl Path
From the Osprey checkout, log into AWS and start the tunnel. Run just aws login, then just tunnel start. After that, kubectl logs -n osprey-main -f --tail=100 deployment/osprey-api streams API logs. Swap the deployment name for web, MCP, or mock as needed. Stop the tunnel with just tunnel stop when you are done.
First-Time Gotchas
Most setup failures are identity or path errors. Use the full jumpbox SSH key path such as ~/.ssh/id_ed25519_jumpbox, not a bare filename. The jumpbox username is the Unix user, not the local AWS profile name. The cluster is constructured-one in us-east-2; the recorded tunnel setup used the insecure cert method for cluster TLS.
Logs are not the system, but they are often the first shared evidence a developer can get. When someone reports that an Osprey action failed, the useful first move is rarely “read every log line.” It is to choose the right log path for the question in front of you.
Osprey has two practical log entry points. Grafana is the dashboard/search path: use it when you need a time window, filters, and correlation across services. Kubectl is the cluster path: use it when you need to tail the running deployment, check whether a rollout changed behavior, or recover logs from a container that just restarted.
Start in Grafana for investigation. Drop to kubectl when you need live terminal evidence or when Grafana does not answer whether the current deployment is emitting what you expect.
Start With the Question
The right tool depends on what you are trying to learn.
| Question | Better first stop | Why |
|---|---|---|
| “What happened around 10:42?” | Grafana | Time range, label filters, and search terms matter more than a live stream. |
| “Did this request hit the API?” | Grafana | You can filter by time, service, request text, route, status, or correlation clue. |
| “Is the API currently throwing this error?” | kubectl | A live tail gives immediate evidence while you reproduce. |
| “Did the web deployment start cleanly?” | kubectl | The deployment target follows the current pods without copying random suffixes. |
| “What did the previous crashed container say?” | kubectl | --previous asks Kubernetes for the last container instance’s logs. |
Grafana and kubectl are not competing sources of truth. They are two views into the same operational surface. Grafana is usually calmer because you can bracket time before you read. Kubectl is sharper because you can run one command and watch the deployment speak.
A log investigation is strongest when it names the time window, namespace, workload, and search clue before anyone starts scrolling.
The Map
The main Osprey environment runs in the Kubernetes namespace osprey-main.
| Deployment | What it is | When to inspect it |
|---|---|---|
osprey-api |
Go API | Most application behavior, backend errors, auth decisions, webhook handling, database-facing paths. |
osprey-web |
Next.js frontend | Server-side rendering, frontend server logs, startup or deployment issues. |
osprey-mcp |
MCP server | Agent/tool integration behavior. |
osprey-mock |
Mock API | Mocked provider behavior, local/demo-style dependency stand-ins. |
Use deployments, not pods, when possible. A pod name includes a generated suffix that changes on rollout. deployment/osprey-api remains stable and lets Kubernetes select the current pods behind that deployment.
To see the current pods when you need them:
kubectl get pods -n osprey-main
That command is useful for orientation, but do not copy a pod name into a runbook unless you specifically need one pod. The durable target is the deployment.
Grafana Path
Grafana is the first stop for most investigations because it lets you reduce the problem before reading lines. The exact left-nav names can move as Grafana changes, but the shape stays the same: open the logs/search surface, pick the logs data source, set a time range, then filter down to Osprey.
A good Grafana pass looks like this:
- Set the time range from the report. If the report says “just now,” still pick a bounded range such as the last 15 or 30 minutes.
- Select the logs data source, usually Loki or the configured cluster logs source.
- Filter to the Kubernetes namespace
osprey-main. - Narrow to the workload label for
osprey-api,osprey-web,osprey-mcp, orosprey-mock. - Search for the most specific safe clue: request ID, route, job ID, ECO/job identifier, status text, exception name, or exact user-facing error.
- Expand the line only after the result set is small enough to read.
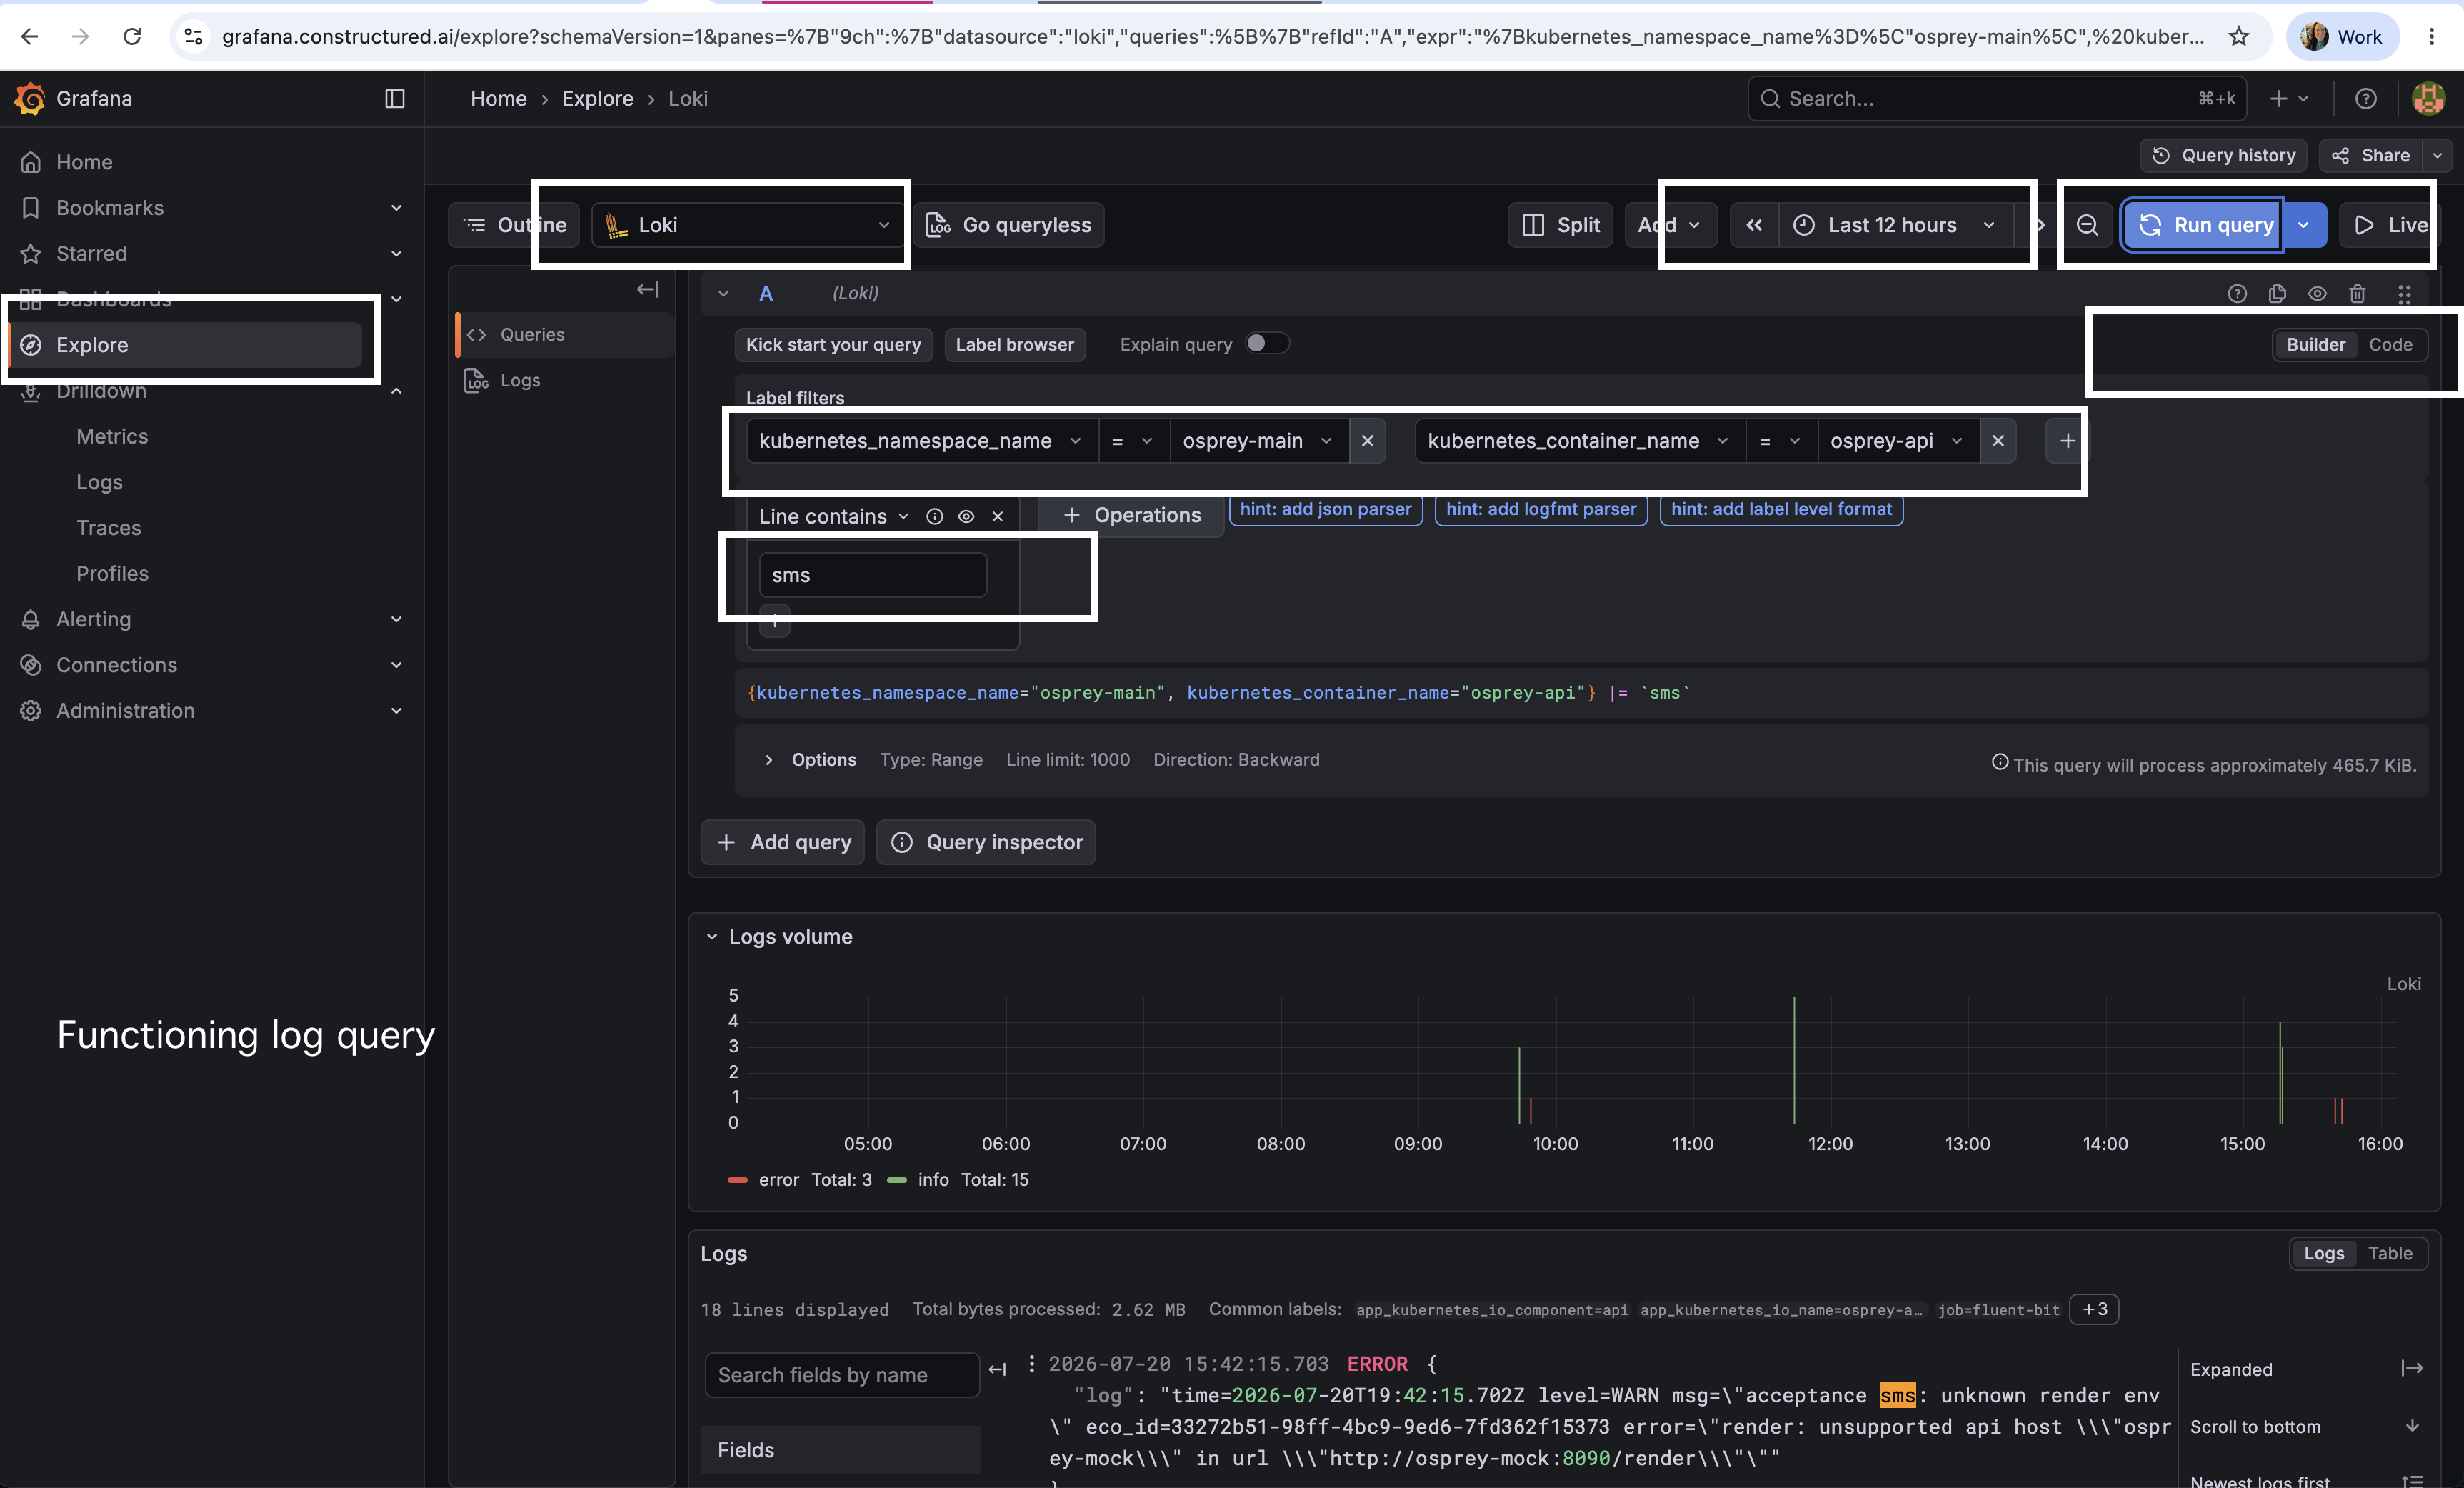
osprey-main and the target container, then runs a bounded text search over a recent time window.Depending on the configured labels, the query may use names such as namespace, namespace_name, app, container, deployment, or pod. Do not treat label spelling as doctrine from memory; let Grafana’s label browser autocomplete the actual keys.
If Grafana autocomplete shows more than one promising label, start with namespace plus a broad text search, then add the workload label after you confirm which label key the cluster is currently using.
For API-heavy incidents, start with osprey-api. It is the busiest service and usually the most useful log stream. Move to osprey-web when the symptom is page rendering, frontend server behavior, or app startup. Use osprey-mock when the thing under test depends on mocked provider responses. Use osprey-mcp when the question involves agent-facing tools rather than ordinary user traffic.
Grafana is also the place to compare services in the same time window. If the web app reports a failure at 10:42, search the web logs at 10:42, then the API logs in the same window. If the API shows an outbound/provider failure, keep the time window fixed while you search the relevant provider or mock service.
Kubectl Path
Kubectl access depends on the AWS/jumpbox tunnel. From the Osprey checkout, the daily path is:
just aws login
just tunnel start
After the tunnel is up, kubectl talks to the cluster from your laptop shell. The main namespace is osprey-main:
kubectl get pods -n osprey-main
For the common case, target the deployment and stream only the recent tail:
kubectl logs -n osprey-main -f --tail=100 deployment/osprey-api
Ctrl-C stops the stream. It does not stop the pod.
Print a whole deployment log once:
kubectl logs -n osprey-main deployment/osprey-web
Print only the recent tail:
kubectl logs -n osprey-main --tail=100 deployment/osprey-mock
Read logs from before the last restart:
kubectl logs -n osprey-main --previous deployment/osprey-api
Swap osprey-api for osprey-web, osprey-mcp, or osprey-mock as needed.
When you are done:
just tunnel stop
If you are working in osprey-main for a while, you can set the namespace on the current kubectl context:
kubectl config set-context --current --namespace=osprey-main
After that, the -n osprey-main flag is no longer required for ordinary commands in that shell context. Be careful when switching environments; an implicit namespace is convenient right up until you forget it is set.
First-Time Gotchas
The first tunnel setup has a few predictable failure modes.
Use the full SSH key path for the jumpbox key:
~/.ssh/id_ed25519_jumpbox
A bare filename such as id_ed25519_jumpbox is looked up in the current directory and fails.
The jumpbox username is the Unix username on the jumpbox, not necessarily the AWS profile name. The setup note that prompted this cairn recorded laura as the jumpbox username for that profile. If tunnel startup fails with a public-key permission error, check JUMPBOX_USER in the relevant profile env file, such as:
infrastructure/eks-tunnel/profiles/laurak.env
The recorded cluster setup values were:
| Field | Value |
|---|---|
| Cluster | constructured-one |
| Region | us-east-2 |
| Certificate method | insecure |
The insecure certificate method affects cluster TLS verification in the tunnel setup. It does not weaken SSH authentication to the jumpbox.
If kubectl fails after the tunnel starts, separate tunnel failure from Kubernetes context failure. First confirm AWS SSO is current, then confirm the tunnel process is running, then inspect the active kubectl context and namespace.
How to Hand Off Evidence
A good log handoff is short and reproducible. Include the path you used, the time window, the workload, and the exact clue you searched.
For Grafana:
Grafana, logs source, 15:35-15:50 MDT, namespace=osprey-main,
deployment=osprey-api, searched "<error text or request id>".
For kubectl:
kubectl logs -n osprey-main -f --tail=100 deployment/osprey-api
Then quote only the few relevant lines, with secrets and private identifiers removed. Do not paste broad raw log dumps into Slack or GitHub. If the useful evidence is a pattern, summarize the pattern and keep the full log in the system that already stores it.
This is where logs connect back to the broader Osprey operating model. Running in Production explains the deployed stack. Trace the Work, Not Just the Error explains why logs are only one layer of evidence. This cairn is the hands-on bridge: enough command and dashboard vocabulary for a new developer to find the right lines without turning production debugging into archaeology.
Summary
- Use Grafana first for bounded, searchable investigations across time windows and services.
- Use kubectl through the AWS/jumpbox tunnel for live tails, current deployment checks, and `--previous` crash evidence.
- The main namespace is `osprey-main`; the common deployments are `osprey-api`, `osprey-web`, `osprey-mcp`, and `osprey-mock`.
- Target deployments instead of pods unless you intentionally need one generated pod name.
- Record the path, time window, workload, and search clue when handing logs to another developer.
Discussion Prompts
- Which Grafana label keys should we standardize in examples once the team confirms the current Loki schema?
- Should `just tunnel start` print the active namespace and a copy-paste log command for `osprey-api`?
- What log fields would make Osprey API incidents easier to correlate with user reports?
References
- Osprey - Investigating API / Web / Mock Logs on the Server - Internal command reference for AWS SSO, the EKS tunnel, the `osprey-main` namespace, deployment log commands, and first-time tunnel gotchas.
- Running in Production - Background on the Osprey Strike production stack and Kubernetes/GitOps architecture.
- Trace the Work, Not Just the Error - Broader operational framing for using logs as one part of a causal trace.
Generated by Cairns · Agent-powered with Claude